Google Charts is the popular charting tool library available now. It is used to create a variety of charts like Geo Chart, Bubble Chart and Pie chart. Initially, this library was used for Google’s internal applications for rendering charts. Later Google released it for the public.
Google charts API has numerous functions and properties for creating efficient interactive charts. It has good cross-browser compatibility and also supports legacy browsers well.
The charts are created as SVG images and embedded into the view by using the HTML5 <svg> element. Previously, we have created HTML5 canvas layer for rendering a dynamically created image object and I recommend you to go through it.
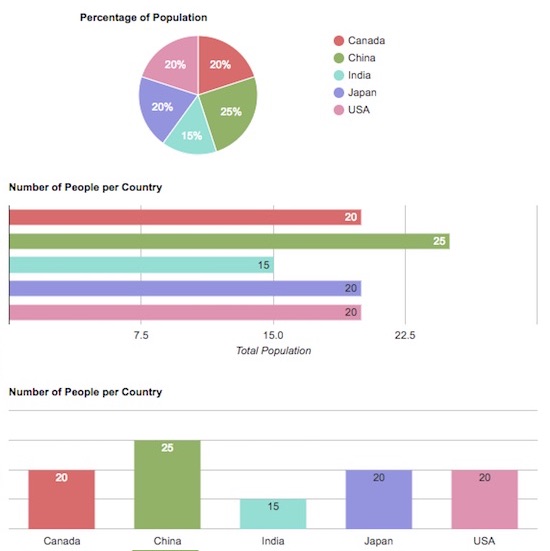
Visit Google Charts documentation to know more about it. In this article, we are going to see a simple example to create a pie chart, column and bar charts using Google Charts API. In this example, the chart data are dynamic from the database. The database results are used to calculate the statistics to be seen in the graphical view.
In the database, it has a table for storing people data with their country name. By grouping people by the country name, the chart will show the statistics about the population of each country. In a previous code, we have already seen how to create a dynamic data graph using Chart.js.
Read Database Results and Create Chart Data
In this section, it shows the PHP code to read data from the database table tbl_people_country. After executing the below query, the result will contain the number of people per country. By iterating this result, this PHP code splits the country and the people data into two separate arrays. These data will be set to the horizontal and vertical metrics of the graph. In this PHP code, it also forms the color specification that will be set to the chart library options while drawing.
<?php
$connect = mysqli_connect("localhost","root","test","blog_samples");
$query = "SELECT count(Name) as People, Country FROM `tbl_people_country` GROUP by Country";
$result = mysqli_query($connect , $query);

$resultCount=$result->num_rows;

$color = ['#dc7877','#9cbb73','#9ee2d9','#9f9ee2','#e29eba'];
$country = array();
$people = array();
foreach ($result as $peopleData) {
    $country[] = $peopleData['Country'];
    $people[] = $peopleData['People'];
}
?>
HTML View to Display (Pie Bar Column) Charts View
This is the HTML page used to show the (Pie Bar Column) charts created using Google Charts. It has three DIV containers to show the various type of charts. These DIVs are specified with a unique id and it will be referred while drawing the chart.
<html>
  <head>
    <meta name="viewport" content="width=device-width, initial-scale=1.0">
    <script type="text/javascript" src="https://www.gstatic.com/charts/loader.js"></script>
    <script type="text/javascript" src="//ajax.googleapis.com/ajax/libs/jquery/1.10.2/jquery.min.js"></script>
    <link rel="stylesheet" type="text/css" href="style.css">
  </head>

  <body>
    <div id="chart_container">
      <div id="pie-chart" class="chart-div"></div>

      <div id="bar-chart" class="chart-div"></div>

      <div id="column-chart" class="chart-div"></div>
    </div>
  </body>
</html>
Javascript to Load Google Charts
On loading the above HTML page, the Google Charts library will be loaded and functions to draw the charts are called in a JavaScript. While drawing each type of chart, the chart instance is created by specifying the target DIV element with its id reference. By using this instance, the Google Charts draw method will be invoked by sending the dynamic data and chart options.
The JavaScript for loading Google Charts to draw(Pie Bar Column) charts is shown below. The setOnLoadCallback method is used to call the JavaScript functions that are created to draw chart images.
Then, the chart options are set based on the type of the chart. For example, we set the vAxis, hAxis params to specify the horizontal and verticle parameters while drawing the column or bar chart. For all the charts the colors are taken from the PHP array which is predefined in the PHP code at the beginning of this example.
<script type="text/javascript">
    google.charts.load('current', {'packages':['corechart']});

    google.charts.setOnLoadCallback(drawPieChart);

    function drawPieChart() {

      var data = new google.visualization.arrayToDataTable([
        ["Country","People"],
        <?php
        for($i=0;$i<$resultCount;$i++){
          ?>[<?php echo "'".$country[$i]."', ".$people[$i] ?>],
        <?php }
        ?>
        ]);

      var options = {
          title: "Percentage of Population",
          width: '100%',
          height: '200px',
          colors: [
            <?php
            for($i=0;$i<$resultCount;$i++) {
              echo "'".$color[$i]."',";
            }
            ?>
          ]
        };
      var chart = new google.visualization.PieChart(document.getElementById('pie-chart'));
      chart.draw(data, options);
    }

    google.charts.load('current', {packages: ['corechart', 'bar']});
    google.charts.setOnLoadCallback(drawBarBasic);

    function drawBarBasic() {

      var data = new google.visualization.arrayToDataTable([
         ['Country', 'Population', { role: 'style' }, { role: 'annotation' }],
        <?php
        for($i=0;$i<$resultCount;$i++){
          ?>[<?php echo "'".$country[$i]."', ".$people[$i].", '".$color[$i]."' , "."'".$people[$i]."'" ?>],
        <?php }
        ?>
        ]);

      var options = {
    	    title: "Number of People per Country",
        chartArea: {width: '100%'},
        hAxis: {
          title: 'Total Population',
          minValue: 0
        },
        vAxis: {
          title: 'City'
        },
        legend: { position: "none" }
      };

      var chart = new google.visualization.BarChart(document.getElementById('bar-chart'));

      chart.draw(data, options);
    }

  google.charts.load("current", {packages:['corechart']});
    google.charts.setOnLoadCallback(drawColumnChart);
    function drawColumnChart() {
      var data = google.visualization.arrayToDataTable([
        ['Country', 'Population', { role: 'style' }, { role: 'annotation' }],
        <?php
        for($i=0;$i<$resultCount;$i++){
          ?>[<?php echo "'".$country[$i]."', ".$people[$i].", '".$color[$i]."' , "."'".$people[$i]."'" ?>],
        <?php }
        ?>
        ]);


      var options = {
        title: "Number of People per Country",
        chartArea: {width: '100%'},
        legend: { position: "none" },
      };
      var chart = new google.visualization.ColumnChart(document.getElementById("column-chart"));
      chart.draw(data, options);
  }
  </script>
Responsive Google Charts
In the above JavaScript, the chart view size is specified in percentage by setting the width of the chart area. This will make the Google Charts output responsive to the viewport size. Added to the specification of the viewport meta, this script is also managed responsiveness to scale the chart view according to the viewport.
Note: As it is done with the script on page load, we have to refresh to make the responsiveness to be effective.
Database Script
This is the SQL script for creating the database table and load the data that are plotted on the Google chart view.
--
-- Table structure for table `tbl_people_country`
--

CREATE TABLE `tbl_people_country` (
  `id` mediumint(8) UNSIGNED NOT NULL,
  `Name` varchar(255) DEFAULT NULL,
  `Country` varchar(255) NOT NULL
) ENGINE=InnoDB DEFAULT CHARSET=latin1;

--
-- Dumping data for table `tbl_people_country`
--

INSERT INTO `tbl_people_country` (`id`, `Name`, `Country`) VALUES
(1, 'Ingrid', 'USA'),
(2, 'Ishmael', 'USA'),
(3, 'Castor', 'USA'),
(4, 'Arsenio', 'USA'),
(5, 'Conan', 'USA'),
(6, 'Eric', 'USA'),
(7, 'Zenaida', 'USA'),
(8, 'Slade', 'USA'),
(9, 'Ingrid', 'USA'),
(10, 'Armand', 'USA'),
(11, 'Martin', 'USA'),
(12, 'Adam', 'USA'),
(13, 'Preston', 'USA'),
(14, 'Laith', 'USA'),
(15, 'Dean', 'USA'),
(16, 'Talon', 'USA'),
(17, 'Brianna', 'USA'),
(18, 'Sydnee', 'USA'),
(19, 'Britanney', 'USA'),
(20, 'Mohammad', 'USA'),
(21, 'Christopher', 'India'),
(22, 'Ursula', 'India'),
(23, 'Nehru', 'India'),
(24, 'Selma', 'India'),
(25, 'Christian', 'India'),
(26, 'Kylie', 'India'),
(27, 'Garrison', 'India'),
(28, 'Katelyn', 'India'),
(29, 'Chandler', 'India'),
(30, 'Colt', 'India'),
(31, 'Ella', 'India'),
(32, 'Rooney', 'India'),
(33, 'Honorato', 'India'),
(34, 'Herman', 'India'),
(35, 'Ainsley', 'India'),
(36, 'Sean', 'China'),
(37, 'Herman', 'China'),
(38, 'Colette', 'China'),
(39, 'Abdul', 'China'),
(40, 'Colleen', 'China'),
(41, 'Russell', 'China'),
(42, 'Wynter', 'China'),
(43, 'Iliana', 'China'),
(44, 'Nicole', 'China'),
(45, 'Hermione', 'China'),
(46, 'Adena', 'China'),
(47, 'Jane', 'China'),
(48, 'Desirae', 'China'),
(49, 'Colorado', 'China'),
(50, 'Alec', 'China'),
(51, 'Shaine', 'China'),
(52, 'Carly', 'China'),
(53, 'Hyacinth', 'China'),
(54, 'Keith', 'China'),
(55, 'Ariana', 'China'),
(56, 'Jack', 'China'),
(57, 'Octavius', 'China'),
(58, 'Miriam', 'China'),
(59, 'Wang', 'China'),
(60, 'Cleo', 'China'),
(61, 'Nathan', 'Canada'),
(62, 'Dorian', 'Canada'),
(63, 'Nomlanga', 'Canada'),
(64, 'Eve', 'Canada'),
(65, 'Jacob', 'Canada'),
(66, 'Amber', 'Canada'),
(67, 'Tana', 'Canada'),
(68, 'Erasmus', 'Canada'),
(69, 'Caldwell', 'Canada'),
(70, 'Yardley', 'Canada'),
(71, 'Carly', 'Canada'),
(72, 'Karina', 'Canada'),
(73, 'Leo', 'Canada'),
(74, 'Kitra', 'Canada'),
(75, 'Amethyst', 'Canada'),
(76, 'Murphy', 'Canada'),
(77, 'Graiden', 'Canada'),
(78, 'Drew', 'Canada'),
(79, 'Tallulah', 'Canada'),
(80, 'Grady', 'Canada'),
(81, 'Hillary', 'Japan'),
(82, 'Brent', 'Japan'),
(83, 'Hamilton', 'Japan'),
(84, 'Roary', 'Japan'),
(85, 'Lee', 'Japan'),
(86, 'Elton', 'Japan'),
(87, 'Heidi', 'Japan'),
(88, 'Wyoming', 'Japan'),
(89, 'Hyatt', 'Japan'),
(90, 'Mason', 'Japan'),
(91, 'Harlan', 'Japan'),
(92, 'Kato', 'Japan'),
(93, 'Aretha', 'Japan'),
(94, 'Leilani', 'Japan'),
(95, 'Lydia', 'Japan'),
(96, 'Dalton', 'Japan'),
(97, 'Giacomo', 'Japan'),
(98, 'Deanna', 'Japan'),
(99, 'Hamilton', 'Japan'),
(100, 'Hanae', 'Japan');

--
-- Indexes for table `tbl_people_country`
--
ALTER TABLE `tbl_people_country`
  ADD PRIMARY KEY (`id`);

--
-- AUTO_INCREMENT for dumped tables
--

--
-- AUTO_INCREMENT for table `tbl_people_country`
--
ALTER TABLE `tbl_people_country`
  MODIFY `id` mediumint(8) UNSIGNED NOT NULL AUTO_INCREMENT, AUTO_INCREMENT=101;
COMMIT;