Visualization and charts let users process data and statistics easier. Are you looking for a way to present complex statistics in your application? Do you want to know how to create a chart in PHP, then this page is going to help you.
Right from presenting in school exams to high complex statistics in software, charts and graphs are the front runner candidate to be a winner.
I have exploited it many times in my exams to gain good marks ;-) Still, it works for me when I present stats to my clients. Go for it. Always look for opportunities to present data as charts.
There are numerous libraries to create charts in web UI. Chart.js is one of those options which is open-source to display HTML5 charts.
The Chart.js library is simple to integrate into the application. It provides an easy guide to get started with creating charts.
This article has an example to create bar, doughnut and pie charts in the front end. It uses a database source to set the chart dataset. Previously, we have seen examples to compare data with bar charts created using the Hicharts.

What is inside – How to create chart in PHP!
- About this example
- HTML canvas to render charts
- Initialize Chart.js and load data into charts
- Create PHP Model, Utils to prepare chart data
- Database script
- Output – Chart dataset and UI screenshot
About this example
This example will help you to create a chart in PHP. It reads data from the database and load into the dynamic charts created using Chart.js.
The database has a table with student marks. This code is to create different types of charts with the student marks.
It has the Chart.js script to create a basic column chart, pie and doughnut charts, and a stacked vertical bar chart.
The script uses jQuery post method to request dynamic data from PHP. This endpoint connects the database to retrieve data and prepare the JSON response.
The JSON format varies based on the type of chart to create. There are separate JavaScript functions to create charts and display each dynamic chart.
The following image shows the file structure of this example. This code imports the Chart.js JavaScript library by using the CDN URL. You can also keep it in the local by downloading the source from Github.

HTML canvas to create chart
To create a chart on the web, we need an HTML canvas. This canvas element is a target layer to render the chart unit.
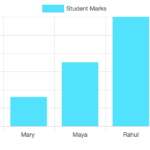
In a previous tutorial, we have rendered a simple bar chart using Chart.js into the HTML5 canvas.
The following code displays canvas elements of charts to render using this library.
The HTML code imports the CDN URL of the chart.js library. It also includes custom JavaScript graph.js to invoke initialization to render charts.
index.php
<!DOCTYPE html>
<html>
<head>
<title>Creating Dynamic Data Graph using PHP and Chart.js</title>
<style type="text/css">
.chart-container {
	display: inline-block;
	width: 40%;
}

.pie-chart {
	margin: 40px 20px;
}
</style>
<script type="text/javascript" src="vendor/jquery.min.js"></script>
<script
	src="https://cdnjs.cloudflare.com/ajax/libs/Chart.js/2.8.0/Chart.bundle.min.js"></script>
</head>
<body>
	<div class="chart-container">
		<canvas id="bar-chart"></canvas>
	</div>
	<div class="chart-container pie-chart">
		<canvas id="pie-chart"></canvas>
	</div>
	<div class="chart-container pie-chart">
		<canvas id="doughnut-chart"></canvas>
	</div>
	<div class="chart-container">
		<canvas id="stacked-vertical-chart"></canvas>
	</div>
	<script src="./assets/js/graph.js"></script>

	<script>
    $(document).ready(function () {
       showBarChart();
       showPieChart();
        showDoughnutChart();
       showStackedVerticalChart();
    });
	</script>

</body>
</html>
Initialize Chart.js and load data into dynamic charts
The following JavaScript contains four separate functions. It creates bar, doughnut, pie and stacked-column charts.
Each function requests the PHP endpoint to get the dynamic chart data.
It uses the jQuery post method to call the PHP file from JavaScript. In a previous tutorial, we have seen how to use jQuery load method to render HTML dynamically
The endpoint URL includes the chart type in its query string. Based on this param the response data will vary.
This script loads the dynamic response data into the chart. The chart legends and labels are also dynamic from the database fetched using PHP.
assets/js/graph.js
function showBarChart() {
	{
		$.post("ajax-endpoint/get-chart-data.php?chart_type=bar",
			function(data) {
				console.log(data);
				var name = [];
				var marks = [];

				for (var i in data) {
					name.push(data[i].student_name);
					marks.push(data[i].marks);
				}

				var chartdata = {
					labels: name,
					datasets: [
						{
							label: 'Student Marks',
							backgroundColor: '#49e2ff',
							borderColor: '#46d5f1',
							hoverBackgroundColor: '#CCCCCC',
							hoverBorderColor: '#666666',
							data: marks
						}
					]
				};

				var graphTarget = $("#bar-chart");

				var graph = new Chart(graphTarget, {
					type: 'bar',
					data: chartdata
				});
			});
	}
}

function showPieChart() {
	{
		$.post("ajax-endpoint/get-chart-data.php?chart_type=pie",
			function(data) {
				var name = [];
				var marks = [];
				var bgColor = [];

				for (var i in data) {
					name.push(data[i].label);
					marks.push(data[i].data);
					bgColor.push(data[i].backgroundColor);
				}

				var chartdata = {
					labels: name,
					datasets: [
						{
							label: 'Student Marks',
							backgroundColor: bgColor,
							data: marks
						}
					]
				};

				var graphTarget = $("#pie-chart");

				var graph = new Chart(graphTarget, {
					type: 'pie',
					data: chartdata
				});
			});
	}
}

function showDoughnutChart() {
	{
		Chart.pluginService.register({
			beforeDraw: function(chart) {
				var width = chart.chart.width,
					height = chart.chart.height + 35,
					ctx = chart.chart.ctx;

				ctx.save();
				ctx.font = "bold 1.5em sans-serif";
				ctx.textBaseline = "middle";


				var text = "100",
					textX = Math.round((width - ctx.measureText(text).width) / 2),
					textY = height / 2;
				ctx.fillStyle = 'rgba(0, 0, 0, 1)';
				ctx.fillText(text, textX, textY);
				ctx.restore();
			}
		});

		$.post("ajax-endpoint/get-chart-data.php?chart_type=doughnut",
			function(data) {
				var name = [];
				var marks = [];
				var bgColor = [];

				for (var i in data) {
					name.push(data[i].label);
					marks.push(data[i].data);
					bgColor.push(data[i].backgroundColor);
				}

				var chartdata = {
					labels: name,
					datasets: [
						{
							label: 'Student Marks',
							backgroundColor: bgColor,
							data: marks
						}
					]
				};

				var graphTarget = $("#doughnut-chart");

				var graph = new Chart(graphTarget, {
					type: 'doughnut',
					data: chartdata,
					options: {
					}
				});
			});
	}
}


function showStackedVerticalChart() {
	{
		$.post("ajax-endpoint/get-chart-data.php?chart_type=vertical-bar",
			function(data) {
				var chartdata = {
					labels: ['Marks'],
					datasets: data
				};

				var graphTarget = $("#stacked-vertical-chart");

				var graph = new Chart(graphTarget, {
					type: 'bar',
					data: chartdata,
					options: {
						scales: {
					        xAxes: [{
					        	barPercentage: 0.3,
            					stacked: true
					        }],
					        yAxes: [{
					        	stacked: true
					        }]
					    }
					}
				});
			});
	}
}
Create PHP Model, Utils to prepare chart data
When we create a chart in PHP with dynamic data, it depends on the model or service handers on the server-side.
The model prepares the dynamic data format from an external source like files or a database.
In this model, the handlers read the chart data from the database. The chart.tbl_marks table maps the student identity data with the marks one-to-one.
lib/Student.php
<?php
namespace Phppot;

class Student
{

    private $dbConn;

    public function __construct()
    {
        require_once __DIR__ . '/DataSource.php';
        $this->dbConn = new DataSource();
    }

    function getStudentMark()
    {
        $query = "SELECT student_id,student_name,marks FROM tbl_marks ORDER BY student_id";
        $result = $this->dbConn->select($query);
        return $result;
    }
}
And, it has the utils class to dynamically supply the background color to the chart.
The Util class generates the random color code to the chart slices and the stacked bars.
When we see how to create charts using Google Charts, it has a fixed array of colors supplied to the chart slices.
The Google Charts services also provide very good results for showing statistical graphs.
lib/Util.php
<?php
namespace Phppot;

class Util
{

    function getRGBRandom()
    {
        $rgbRandom = str_pad(dechex(mt_rand(0, 255)), 2, '0', STR_PAD_LEFT);
        return $rgbRandom;
    }

    function getRandomColor()
    {
        $randomColor = "#";
        for ($i = 0; $i < 3; $i ++) {
            $randomColor .= $this->getRGBRandom();
        }
        return $randomColor;
    }
}
Database script
This database script shows the statements to create the table structure. It also has the sample data to load into the chart initialization process. Download the code and import the script to run this chart example.
In a previous article, we have created a database to keep attendance data. Thereby, it created charts using Google charts.
-- -- Database: `chart` -- -- -------------------------------------------------------- -- -- Table structure for table `tbl_marks` -- CREATE TABLE `tbl_marks` ( `student_id` int(10) UNSIGNED NOT NULL, `student_name` varchar(35) NOT NULL, `marks` int(11) DEFAULT 0 ) ENGINE=InnoDB DEFAULT CHARSET=utf8; -- -- Dumping data for table `tbl_marks` -- INSERT INTO `tbl_marks` (`student_id`, `student_name`, `marks`) VALUES (1, 'Matthew', 39), (2, 'Hannah', 46), (3, 'Merlin', 65), (4, 'Jelin', 90), (5, 'Hilda', 75); -- -- Indexes for dumped tables -- -- -- Indexes for table `tbl_marks` -- ALTER TABLE `tbl_marks` ADD PRIMARY KEY (`student_id`); -- -- AUTO_INCREMENT for dumped tables ---- -- AUTO_INCREMENT for table `tbl_marks` -- ALTER TABLE `tbl_marks` MODIFY `student_id` int(10) UNSIGNED NOT NULL AUTO_INCREMENT, AUTO_INCREMENT=6;
Output for dynamic chart
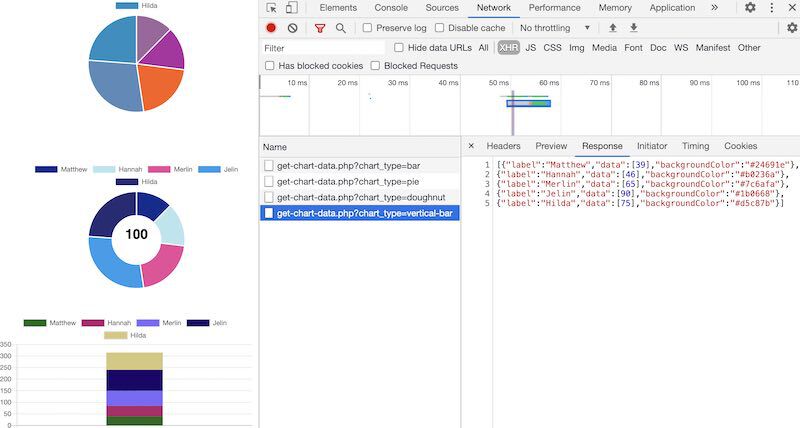
This screenshot shows the dynamic data format created on the server-side. The browser inspection window shows the PHP endpoint requested. By selecting the endpoint URL, it shows corresponding the chart JSON as below.
Conclusion
This article described how to create a chart in PHP with JavaScript library Chart.js. The example code has structured dynamic blocks and the backend logic.
We have displayed the marks statistics in the form of a pie chart, doughnut chart and stacked bar chart. In the doughnut chart, it displays the text to state the mark out of which the student marks are shown.
The separate graph initializations script made the chart rendering process easier. It contains code to supply JSON response into the JavaScript to plot the metrics into the chart UI.
With dynamic data loading, it is possible to make use of this code in a real-time application easily.
Download


Hello Vinci,
i really like to thank you for your comprehensive site, full of knowledge, easy to understand and state of the art coding examples!
Its a fundus of help and i can’t thank you enough for your work!
Please keep on rockin’ :)
A new regular visitor,
Achim
Hi Achim,
Welcome. Thank you so much for the wonderful words. It help!