In this tutorial, we will learn how to create a pie chart using JavaScript libraries. We have used the Chart.js library for generating the pie charts. I have also presented a 3d pie chart example using the Google Charts library as an alternate option.
Let us see the following examples of creating a pie chart using JavaScript.
- Quick example – Simple pie chart example via ChartJS.
- 3D pie chart with Google Charts library.
- Responsive ChartJS pie chart.
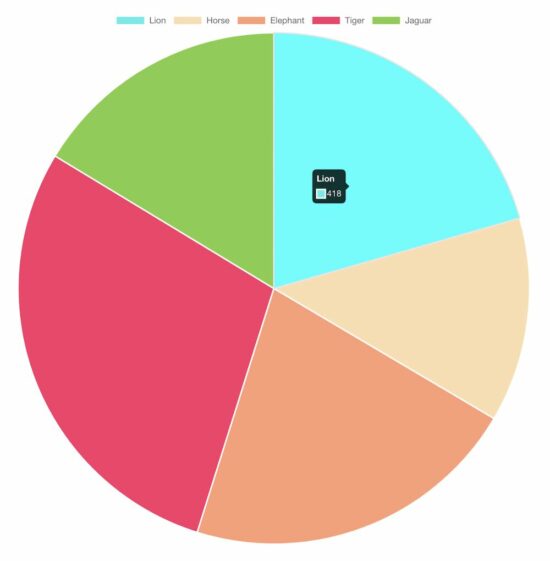
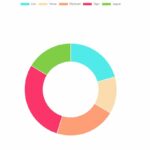
Quick example – Simple pie chart example via ChartJS
<!DOCTYPE html>
<html>
<head>
<title>Chart JS Pie Chart</title>
<link rel='stylesheet' href='style.css' type='text/css' />
</head>
<body>
    <div class="phppot-container">
        <h1>Responsive Pie Chart</h1>
        <div>
            <canvas id="pie-chart"></canvas>
        </div>
    </div>
    <script
        src="https://cdn.jsdelivr.net/npm/chart.js@4.0.1/dist/chart.umd.min.js"></script>
    <script>
        new Chart(document.getElementById("pie-chart"), {
        	type : 'pie',
        	data : {
        		labels : [ "Lion", "Horse", "Elephant", "Tiger",
        				"Jaguar" ],
        		datasets : [ {
        			backgroundColor : [ "#51EAEA", "#FCDDB0",
        					"#FF9D76", "#FB3569", "#82CD47" ],
        			data : [ 418, 263, 434, 586, 332 ]
        		} ]
        	},
        	options : {
        		title : {
        			display : true,
        			text : 'Chart JS Pie Chart Example'
        		}
        	}
        });
	</script>
</body>
</html>
Creating a ChartJS pie chart is a three-step process, as shown below.
- Add the ChartJS library include to the head section of your HTML.
- Add a canvas element to the HTML.
- Add the ChartJS class initiation and invoking script before closing the HTML body tag.
About the ChartJS pie chart script
The script sets the following properties to initiate the ChartJS library.
- type – The type of the chart supported by the ChartJS library.
- data – It sets the chart labels and datasets. The dataset contains the data array and the display properties.
- options – It sets the chart title text and its display flag as a boolean true to show it on the browser.
Output:
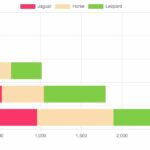
In a previous tutorial, we saw various ways of creating line charts using the Chart JS library.
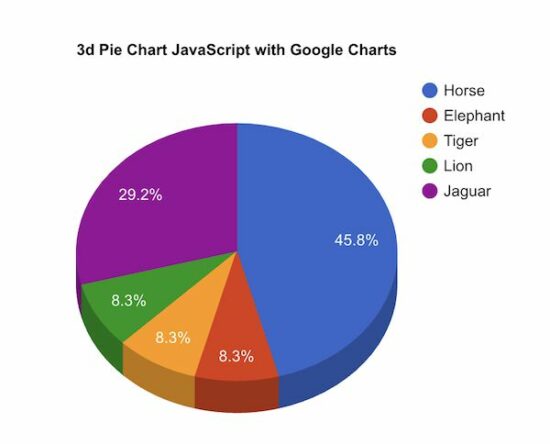
Creating a 3D pie chart
There is no option for a 3D pie chart using chart JS. For those users who have landed here looking for a 3D pie chart, you may try Google Charts.
This example uses Google Charts to create a 3D pie chart for a webpage. In a previous code, we used Google Charts to render a bar chart to show students’ attendance statistics.
The Google Charts JavaScript code prepares the array of animal distribution data. This array is for sending it to the chart data table, which helps to draw the pie chart.
The Google Charts library accepts the is3D with a boolean true to output a 3D pie chart.
It creates a chart visualization object referencing the UI element target. Then, it calls the Google Charts library function to draw and render the chart.
<!DOCTYPE html>
<html>
<head>
<title>3d Pie Chart JavaScript with Google Charts</title>
<link rel='stylesheet' href='style.css' type='text/css' />

<script type="text/javascript"
    src="https://www.gstatic.com/charts/loader.js"></script>
<script type="text/javascript">
	google.charts.load("current", {
		packages : [ "corechart" ]
	});
	google.charts.setOnLoadCallback(drawChart);
	function drawChart() {
		var data = google.visualization.arrayToDataTable([
				[ 'Animal', 'Distribution' ], [ 'Horse', 11 ],
				[ 'Elephant', 2 ], [ 'Tiger', 2 ], [ 'Lion', 2 ],
				[ 'Jaguar', 7 ] ]);

		var options = {
			title : '3d Pie Chart JavaScript with Google Charts',
			is3D : true,
		};

		var chart = new google.visualization.PieChart(document
				.getElementById('3d-pie-chart'));
		chart.draw(data, options);
	}
</script>
</head>
<body>
    <div class="phppot-container">
        <h1>3d Pie Chart JavaScript with Google Charts</h1>
        <div id="3d-pie-chart" style="width: 700px; height: 500px;"></div>
    </div>
</body>
</html>
Responsive pie chart using Chart JS
The Chart JS library provides JavaScript options to make the output pie chart responsive.
This example script uses those options to render a responsive pie chart in a browser.
The JavaScript code to render a responsive pie chart is the same as seen in the quick example above.
The difference is nothing but to set responsive: true in the ChartJS options properties.
If you want to create a responsive chart using Google Charts, the linked article has an example.
<!DOCTYPE html>
<html>
<head>
<title>Responsive Pie Chart</title>
<link rel='stylesheet' href='style.css' type='text/css' />
<meta name="viewport" content="width=device-width, initial-scale=1">
</head>
<body>
    <div class="phppot-container">
        <h1>Responsive Pie Chart</h1>
        <div>
            <canvas id="pie-chart"></canvas>
        </div>
    </div>
    <script
        src="https://cdn.jsdelivr.net/npm/chart.js@4.0.1/dist/chart.umd.min.js"></script>
    <script>
		new Chart(document.getElementById("pie-chart"), {
			type : 'pie',
			data : {
				labels : [ "Lion", "Horse", "Elephant", "Tiger",
						"Jaguar" ],
				datasets : [ {
					backgroundColor : [ "#51EAEA", "#FCDDB0",
							"#FF9D76", "#FB3569", "#82CD47" ],
					data : [ 418, 263, 434, 586, 332 ]
				} ]
			},
			options : {
				title : {
					display : true,
					text : 'Responsive Pie Chart'
				},
				responsive : true
			}
		});
	</script>
</body>
</html>

Wow this is awesome thanks