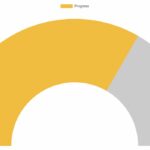
The doughnut chart is similar to the pie chart except for the cutout area in the middle of the pie graph.
It shows the partitions out of a boundary taken. The circle of the pie or doughnut chart is the boundary and the partitions give relational statistics.
This quick example has the Chart JS JavaScript to display a doughnut chart. Earlier, we started with Chart JS line chart and have seen many examples for this library.
View demo
Quick example
<!DOCTYPE html>
<html>
<head>
<title>Chart JS Doughnut</title>
<link rel='stylesheet' href='style.css' type='text/css' />
</head>
<body>
    <div class="phppot-container">
        <h1>Chart JS Doughnut</h1>
        <div>
            <canvas id="chartjs-doughnut"></canvas>
        </div>
    </div>
    <script
        src="https://cdn.jsdelivr.net/npm/chart.js@4.0.1/dist/chart.umd.min.js"></script>
    <script>
        new Chart(document.getElementById("chartjs-doughnut"), {
            type: 'doughnut',
            data: {
                labels: ["Lion", "Horse", "Elephant", "Tiger",
                    "Jaguar"],
                datasets: [{
                    backgroundColor: ["#51EAEA", "#FCDDB0",
                        "#FF9D76", "#FB3569", "#82CD47"],
                    data: [418, 263, 434, 586, 332]
                }]
            },
            options: {
                title: {
                    display: true,
                    text: 'Chart JS Doughnut.'
                },
                cutout: '60%', // the portion of the doughnut that is the cutout in the middle
                radius: 200
            }
        });
	</script>
</body>
</html>
In a previous article, we have seen how to create Chart JS JavaScript library to create a pie chart.
The code doughnut chart differs only by the property type: doughnut instead of type: pie.
Output
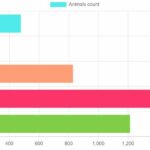
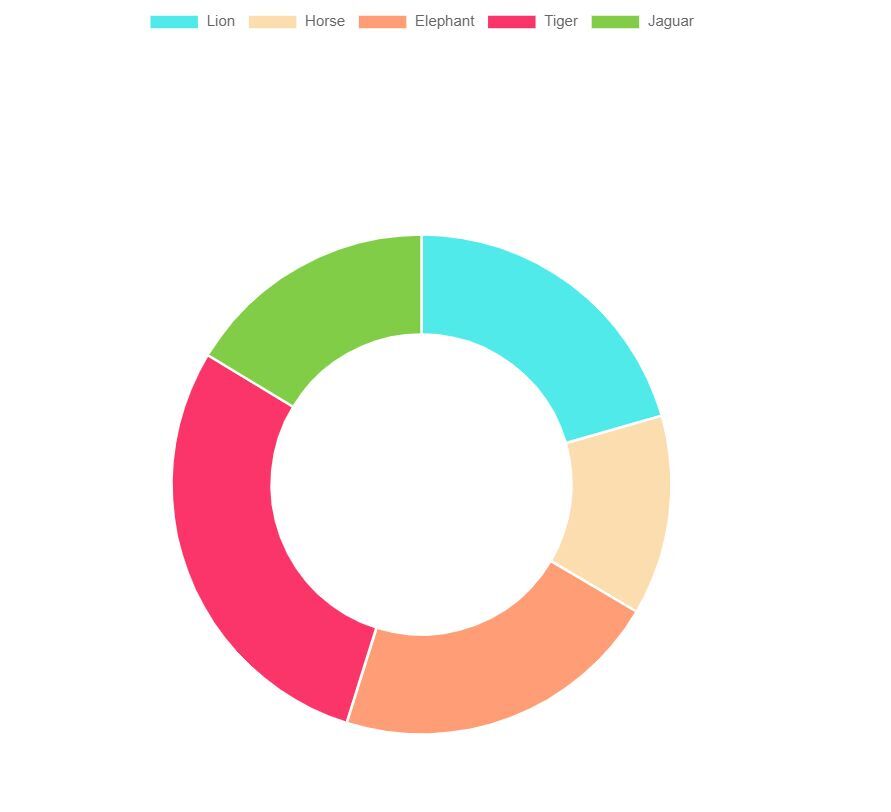
It displays the count of an animal on each wing of the doughnut chat.
As in the pie chart example, the animal names are taken for the “labels” property. The count of each animal is the chart data. Different background colors classify it in the doughnut chart.
The below figure shows the output of this Chart JS doughnut example.
Doughnut Chart with PHP and MySQL Database
This example will be helpful if you want to display dynamic data from an external source.
It uses a database source to supply data for the Chart JS doughnut chart.
The db_chartjs_data is the database that contains the tbl_marks table. It has student’s mark in percentage.
The doughnut chart should display the number of students who got a particular percentage.
doughnut-chart-with-php-database.php
<?php
$conn = new mysqli('localhost', 'root', '', 'db_chartjs_data');
$sql = "SELECT count(*) as marks_percentage_count, percentage FROM tbl_marks GROUP BY percentage";
$result = $conn->query($sql);
{
    $label = array();
    $percentage = array();
    while ($row = $result->fetch_assoc()) {
        $label[] = $row["percentage"] . "%";
        $percentage[] = $row["marks_percentage_count"];
    }
}
$chartLabel = json_encode($label);
$chartData = json_encode($percentage);
?>
<!DOCTYPE html>
<html>
<head>
<title>Doughnut Chart with PHP and MySQL Database</title>
<link rel='stylesheet' href='style.css' type='text/css' />
</head>

<body>
    <div class="phppot-container">
        <h1>Doughnut Chart with PHP and MySQL Database</h1>
        <div>
            <canvas id="chartjs-doughnut"></canvas>
        </div>
    </div>
    <script
        src="https://cdn.jsdelivr.net/npm/chart.js@4.0.1/dist/chart.umd.min.js"></script>
    <script>
        new Chart(document.getElementById("chartjs-doughnut"), {
        	type: 'doughnut',
        	data: {
        		labels: <? php echo $chartLabel; ?>,
        	datasets: [{
        		backgroundColor: ["#51EAEA", "#FCDDB0",
        			"#FF9D76", "#FB3569", "#82CD47"],
        		data:  <? php echo $chartData; ?>
                        }]
                    },
        	options: {
        	title: {
        		display: true,
        		text: 'Chart JS Doughnut'
        	},
        	cutout: '60%', // the portion of the doughnut that is cutout in the middle
        	radius: 200
        }
                });
    </script>
</body>
</html>
This is the database script to import before running this example.
db_chartjs_data.sql
--
-- Database: `db_chartjs_data`
--

--
-- Table structure for table `tbl_marks`
--

CREATE TABLE `tbl_marks` (
  `id` int(11) NOT NULL,
  `name` varchar(55) NOT NULL,
  `percentage` int(11) NOT NULL
) ENGINE=InnoDB DEFAULT CHARSET=utf8mb4;

--
-- Dumping data for table `tbl_marks`
--

INSERT INTO `tbl_marks` (`id`, `name`, `percentage`) VALUES
(1, 'John', 85),
(2, 'Matthew', 85),
(3, 'Tim', 65),
(4, 'Clare', 75),
(5, 'Viola', 85),
(6, 'Vinolia', 75),
(7, 'Laura', 85),
(8, 'Leena', 75),
(9, 'Evan', 85),
(10, 'Ellen', 90);

--
-- Indexes for table `tbl_marks`
--
ALTER TABLE `tbl_marks`
  ADD PRIMARY KEY (`id`);

--
-- AUTO_INCREMENT for dumped tables
--

--
-- AUTO_INCREMENT for table `tbl_marks`
--
ALTER TABLE `tbl_marks`
  MODIFY `id` int(11) NOT NULL AUTO_INCREMENT, AUTO_INCREMENT=11;
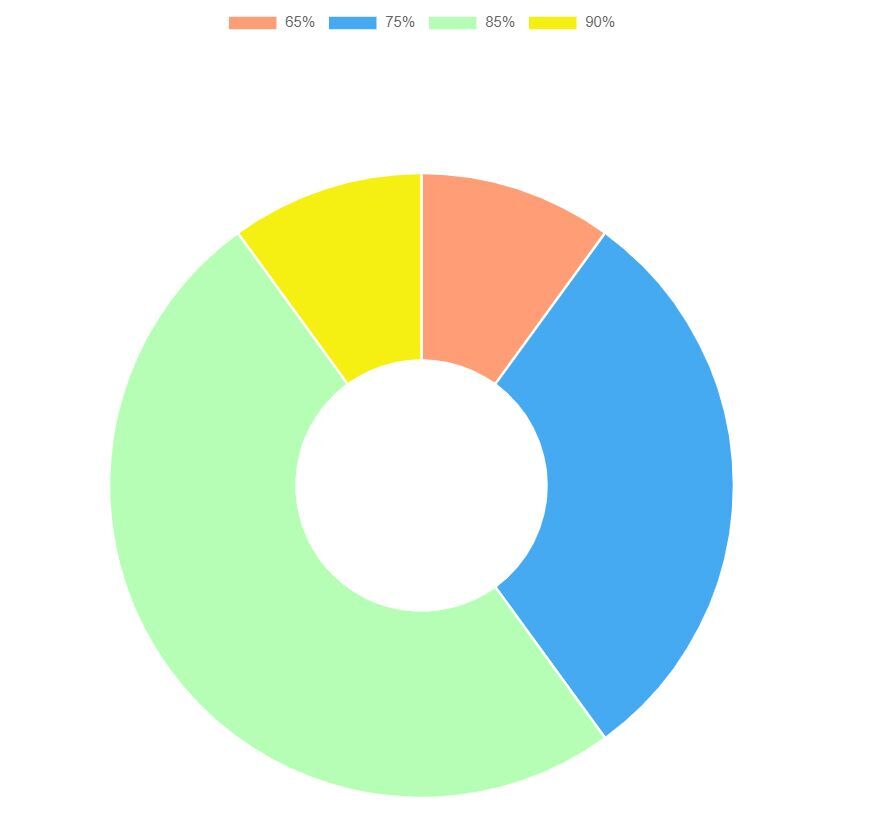
This code prepares a query to fetch the student’s count grouped by percentage. There are four distinct percentages in the database.
This output screenshot displays the number of students who scored a particular percentage.
Output
The ChartJS script to display a doughnut chart requires additional (optional) property. That is, the cutout property specified under the ChartJS options array.
It accepts value in percentage. It decides the transparent area cutout from the middle of the doughnut chart.