The ChartJS library provides modules for creating candlestick charts. It also supports generating OHLC (Open High Low Close) charts.
The candlestick and OHLC charts are for showing financial data in a graph. Both these charts look mostly similar but differ in showing the ‘open’ and ‘close’ points.
In this article, we will see JavaScript code for creating a candlestick chart using ChartJs.
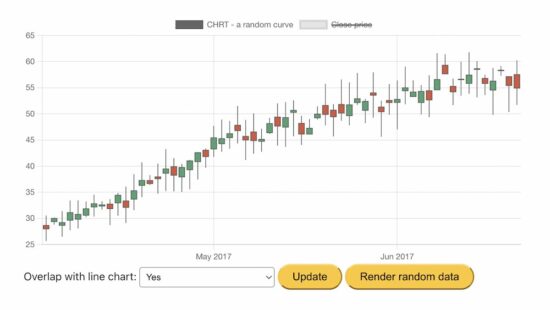
This example generates the random data for the candlestick graph on loading the page.
We have seen many examples of creating ChartJS JavaScript charts. If you are new to the ChartJS library, how to create a bar chart is a simple example for getting started.
What is a Candlestick chart?
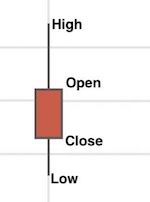
The candlestick chart represents the price movement between Open, High, Low, and Close points.
The candlestick chart shows these 4 points as described below. See the screenshot below to get more clarity.
- Open and Close – in the two top and the bottom extreme of the candle body.
- High and Low- in the two top and the bottom extreme of the candlewick.
HTML target to include ChartJs plugin to show a candlestick chart
This HTML code imports the following libraries for accessing the ChartJS candlestick module.
- Luxon
- ChartJS
- ChartJS adaptor luxon
It also includes the chartjs-chart-finanicial.js JavaScript that inherits the required financial chart controller and elements classes.
An HTML canvas layer has been created to render the output candlestick chart.
JavaScript initiates the financial class instance to generate a candlestick chart by pointing to this canvas as a target.
index.html
<html>

<head>
	<meta charset="utf-8">
	<meta name="viewport" content="width=device-width, initial-scale=1">
	<title>Chart JS Candlestick</title>
	<script src="https://cdn.jsdelivr.net/npm/luxon@1.26.0"></script>
	<script src="https://cdn.jsdelivr.net/npm/chart.js@3.0.1/dist/chart.js"></script>
	<script src="https://cdn.jsdelivr.net/npm/chartjs-adapter-luxon@1.0.0"></script>
	<script src="chartjs-chart-financial.js"></script>
	<link rel="stylesheet" type="text/css" href="style.css">
	<link rel="stylesheet" type="text/css" href="form.css">
</head>

<body>
	<div class="phppot-container">
		<h1>Chart.js - CandleStick chart</h1>
		<canvas id="candlestick-chart"></canvas>
		<div>
			Overlap with line chart:
			<select id="mixed">
				<option value="true">Yes</option>
				<option value="false" selected>No</option>
			</select>
			<button id="update">Update</button>
			<button id="randomizeData">Render random data</button>
		</div>
	</div>
	<script type="text/javascript" src="chart-data-render.js"></script>
</body>

</html>
How to get and plot candlestick random data via JavaScript?
This JavaScript code uses the chartjs.chart.financial.js script functions to create a candlestick chart.
It generates and uses random bar data for the chart. The random data of each bar includes a horizontal coordinate, x, and four vertical coordinates, o, h, l, and c (open, high, low, close).
It performs the below steps during the chart generation process.
- It makes random bar data by taking the initial date and the number of samples.
- It makes ChartJS line chart data using each bar element’s close points.
- It initiates the ChartJS class to set the chart type, dataset, and options as we did in other ChartJS examples.
- It sets the random bar data to the ChartJS dataset property and updates the chart instance created in step 3.
- It checks if the user sets the “Mixed” option and adds the close points to the dataset if yes.
Step 5 overlaps a line chart of close points on the rendered candlestick chart.
chart-data-render.js
var barCount = 60;
var initialDateStr = '01 Apr 2017 00:00 Z';

var ctx = document.getElementById('candlestick-chart').getContext('2d');
ctx.canvas.width = 800;
ctx.canvas.height = 400;

var barData = getRandomData(initialDateStr, barCount);
function lineData() { return barData.map(d => { return { x: d.x, y: d.c } }) };

var chart = new Chart(ctx, {
	type: 'candlestick',
	data: {
		datasets: [{
			label: 'Random Curve',
			data: barData
		}]
	}
});

function randomNumber(min, max) {
	return Math.random() * (max - min) + min;
}

function randomBar(date, lastClose) {
	var open = +randomNumber(lastClose * 0.95, lastClose * 1.05).toFixed(2);
	var close = +randomNumber(open * 0.95, open * 1.05).toFixed(2);
	var high = +randomNumber(Math.max(open, close), Math.max(open, close) * 1.1).toFixed(2);
	var low = +randomNumber(Math.min(open, close) * 0.9, Math.min(open, close)).toFixed(2);
	return {
		x: date.valueOf(),
		o: open,
		h: high,
		l: low,
		c: close
	};

}

function getRandomData(dateStr, count) {
	var date = luxon.DateTime.fromRFC2822(dateStr);
	var data = [randomBar(date, 30)];
	while (data.length < count) {
		date = date.plus({ days: 1 });
		if (date.weekday <= 5) {
			data.push(randomBar(date, data[data.length - 1].c));
		}
	}
	return data;
}
var update = function () {
	var mixed = document.getElementById('mixed').value;
	var closePrice = {
			label: 'Close Price',
			type: 'line',
			data: null
		};
	// put data in chart
	if (mixed === 'true') {
		closePrice = {
			label: 'Close Price',
			type: 'line',
			data: lineData()
		};
	} else {

	}
	chart.config.data.datasets = [
		{
			label: 'Random Curve',
			data: barData
		},
		closePrice
	]
	chart.update();
};
document.getElementById('update').addEventListener('click', update);

document.getElementById('randomizeData').addEventListener('click', function () {
	barData = getRandomData(initialDateStr, barCount);
	update();
});
More functionalities and features are there in the ChartJS module. It allows customizing the output candlestick chart. This example enables two of them.
- Overlap line data over the close points of the candlestick bars.
- I am reloading the candlestick with a new set of random bar data.
ChartJS candlestick functionalities
Some possible customization options for the candlestick chart are listed below.
- To change the bar type between candlestick and OHLC. The OHLC chart will display the ‘open’ and ‘close’ points by horizontal lines on the candle body.
- To change the scale type, border, and color.
- To allow overlapping line charts with the rendered candlestick chart to highlight the close points of the bar data.