The ChartJS JavaScript library supports various types of charts to display on a webpage.
This quick example shows how to display a basic stacked bar chart using this library. The library initiation will be simple for all types of charts as we did in the ChartJS line chart code.
Quick example
<!DOCTYPE html>
<html>
<head>
<title>Chart JS Stacked Bar Chart Example</title>
<link rel='stylesheet' href='style.css' type='text/css' />
</head>
<body>
    <div class="phppot-container">
        <h1>Chart JS Stacked Bar Chart Example</h1>
        <canvas id="stacker-bar-chart"></canvas>
    </div>
    <script
        src="https://cdn.jsdelivr.net/npm/chart.js@4.0.1/dist/chart.umd.min.js"></script>
    <script>
        var ctx = document.getElementById("stacker-bar-chart").getContext('2d');
        var myChart = new Chart(ctx, {
        	type: 'bar',
        	data: {
        		labels: ["<  100", "100 - 200", "300 - 400", "500 - 800", "900 - 1000"],
        		datasets: [{
        			label: 'Lion',
        			backgroundColor: "#51EAEA",
        			data: [90, 120, 305, 526, 958],
        		}, {
        			label: 'Tiger',
        			backgroundColor: "#FCDDB0",
        			data: [82, 145, 335, 516, 936],
        		}, {
        			label: 'Elephant',
        			backgroundColor: "#FF9D76",
        			data: [62, 159, 375, 756, 951],
        		}],
        	},
        	options: {
        		tooltips: {
        			displayColors: true,
        			callbacks: {
        				mode: 'x',
        			},
        		},
        		scales: {
        			x: {
        				stacked: true,
        			},
        			y: {
        				stacked: true
        			}
        		},
        		responsive: true
        	}
        });
	</script>
</body>
</html>
Output:
The graph output displays the stack on a vertical axis. It compares the animals’ counts at each point taken for the graph.

The stacked bar chart plots a group of bars on top of one another. We have already seen grouped bar charts that combine bars side by side.
The grouped and stacked bar charts are used to show a comparison of data.
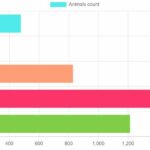
ChartJS Horizontal stacked graph example
This example is to display the stacked chart horizontally. The ChartJS initiation of this example differs from the above code only by the index axis.
This example specifies indexAxis: 'x' to show a horizontal stacked bar chart. By specifying this the data points are taking the x-axis about which the bars are stacked on top of one another.
horizontal-stacked-chart.html
<!DOCTYPE html>
<html>
<head>
<title>Chart JS Horizontal Stacked Bar Chart Example</title>
<link rel='stylesheet' href='style.css' type='text/css' />
</head>
<body>
    <div class="phppot-container">
        <h1>Chart JS Horizontal Stacked Bar Chart Example</h1>
        <canvas id="horizontal-stacker-bar-chart"></canvas>
    </div>
    <script
        src="https://cdn.jsdelivr.net/npm/chart.js@4.0.1/dist/chart.umd.min.js"></script>
    <script>
        var ctx = document.getElementById("horizontal-stacker-bar-chart").getContext('2d');
        var myChart = new Chart(ctx, {
            type: 'bar',
            data: {
                labels: ["<  100", "100 - 200", "300 - 400", "500 - 800", "900 - 1000"],
                datasets: [{
                    label: 'Jaguar',
                    backgroundColor: "#FB3569",
                    data: [90, 120, 305, 526, 958],
                }, {
                    label: 'Horse',
                    backgroundColor: "#FCDDB0",
                    data: [82, 145, 335, 516, 936],
                }, {
                    label: 'Leopard',
                    backgroundColor: "#82CD47",
                    data: [62, 159, 375, 756, 951],
                }],
            },
            options: {
                tooltips: {
                    displayColors: true,
                    callbacks: {
                        mode: 'x',
                    },
                },
                scales: {
                    x: {
                        stacked: true,
                    },
                    y: {
                        stacked: true
                    }
                },
                indexAxis: 'y',
                responsive: true
            }
        });
	</script>
</body>
</html>

About the ChartJS target and parameters to render the stacked bar chart
Let us see some of the important parameters required to create the stacked bar chart for the browser.
The above two examples include the ChartJS library file using the CDN URL. It is preferable compared to having a local copy of this library.
This JS script targets a HTML canvas element to render the stacked bar chart.
It gets the canvas element context and uses it during the ChartJS initiation.
What are the parameters for rendering the stacked bar using ChartJS?
- type – It requires specifying ‘bar’ as we did for displaying a ChartJS bar chart.
- data – It prepares the array of labels and datasets.
- labels parameter has the data points.
- datasets have the readings with appropriate captions and colors.
- options – It specifies the chart properties about the direction or axis. For example,
- tooltips
- scales
- indexAxis
- responsive
This example displays a responsive chart by setting the option responsive as true. We have also used Google charts to create responsive bar/column/pie charts.
View demo Download

Thanks for taking the time to publish this!
This helped me understand how to structure the data properly :)
Welcome Michael.