If we want to visualize statistics, graphs are one of the best ways of representation. Understanding data becomes easy and obvious with the use of graphs. There are various charting libraries like Google Charts, Highcharts, Chart.js and more.
Previously, we have created example code to generate the graph using Highcharts. Let us create an example for creating graph view with the use of Chart.js library.
Creating graph view using Chart.js is simple and easy. I have created the graph output for dynamic data retrieved from the database. I have a MySQL database table tbl_marks containing student marks.
I read the mark data and supplied it to the Chart.js function to create the graph with the mark statistics.
This screenshot shows the graph output generated by Chart.js charting library with the dynamic data from the database.
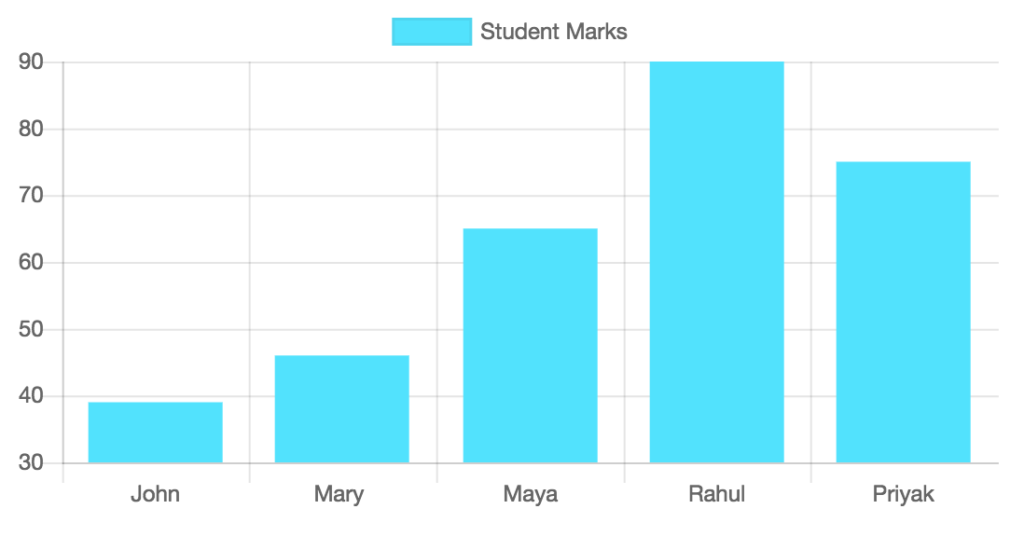
Chart HTML5 Canvas
Download Chartjs library from the GitHub and include the library files in your example. In the landing HTML page, I have a HTML5 canvas element to plot the graph output.
On loading the landing page, I send an AJAX request to the PHP to read student marks from the database. This JSON response will be parsed and supplied as the parameter to the Chart.js function to create the graph.
PHP gives limitless support for handling JSON file via programming with its built-in functions.
<!DOCTYPE html>
<html>
<head>
<title>Creating Dynamic Data Graph using PHP and Chart.js</title>
<style type="text/css">
BODY {
    width: 550PX;
}

#chart-container {
    width: 100%;
    height: auto;
}
</style>
<script type="text/javascript" src="js/jquery.min.js"></script>
<script type="text/javascript" src="js/Chart.min.js"></script>


</head>
<body>
    <div id="chart-container">
        <canvas id="graphCanvas"></canvas>
    </div>

    <script>
        $(document).ready(function () {
            showGraph();
        });


        function showGraph()
        {
            {
                $.post("data.php",
                function (data)
                {
                    console.log(data);
                     var name = [];
                    var marks = [];

                    for (var i in data) {
                        name.push(data[i].student_name);
                        marks.push(data[i].marks);
                    }

                    var chartdata = {
                        labels: name,
                        datasets: [
                            {
                                label: 'Student Marks',
                                backgroundColor: '#49e2ff',
                                borderColor: '#46d5f1',
                                hoverBackgroundColor: '#CCCCCC',
                                hoverBorderColor: '#666666',
                                data: marks
                            }
                        ]
                    };

                    var graphTarget = $("#graphCanvas");

                    var barGraph = new Chart(graphTarget, {
                        type: 'bar',
                        data: chartdata
                    });
                });
            }
        }
        </script>

</body>
</html>
PHP Code to Read Student Marks from MySQL Database
The PHP file data.php is requested via AJAX to access database to read the student marks. After reading the records it returns it as JSON response. The code is,
<?php
header('Content-Type: application/json');

require_once('db.php');

$sqlQuery = "SELECT student_id,student_name,marks FROM tbl_marks ORDER BY student_id";

$result = mysqli_query($conn,$sqlQuery);

$data = array();
foreach ($result as $row) {
	$data[] = $row;
}

mysqli_close($conn);

echo json_encode($data);
?>


thanks. how to reduce the bar width.
Hi Aneesh,
You need to edit the attribute barPercentage to change or fix the bar width in the chart.
Thank you Vincy! Very Useful!
Welcome Francesco.
Thank you! so much
Welcome Serugo.
thank you so much
Welcome Ajay.
How can I add two charts on same page
Hi Hastings,
Use different IDs for graph-target and display accordingly.
how to integrate this in wordpress ?
Hi Neel,
You need to integrate this into your theme and back it up with a plugin.
Thank you Vincy
I thank u Vincy,
Welcome Michel.
Thank you Vincy
Welcome Solomon.
js files are not working for me can could you send me the js files alone….
Hi Samson,
You can get the latest chart JS files from chart.js website.
Thanks alot
Welcome Edson.
thanks very helpful
Welcome Emir.
Thanks, your website is very resourceful.
Welcome Marshall.
This is what i’m looking for.
Thank you so much!
Welcome Memaphu.
How to download chartjs library
Hi Hemanth,
You can get the latest version of Chart.js from npm , the GitHub releases , or use a Chart.js CDN . Detailed installation instructions can be found on the installation page https://www.chartjs.org/docs/latest/getting-started/installation.html .
Great article! Finally helped me track down issues from other examples on the web
Thank you Phil.
how to gave different colors to bar
Hi Nasar Ali,
Specify the bg color array like backgroundColor:[“#FF0000”, “#F0F0F0”] with the datasets.
How to make the same horizontal
See the linked post. The example2 has the code for showing a horizontal bar chart using chartjs JavaScript
https://phppot.com/javascript/chart-js-bar-chart-example/